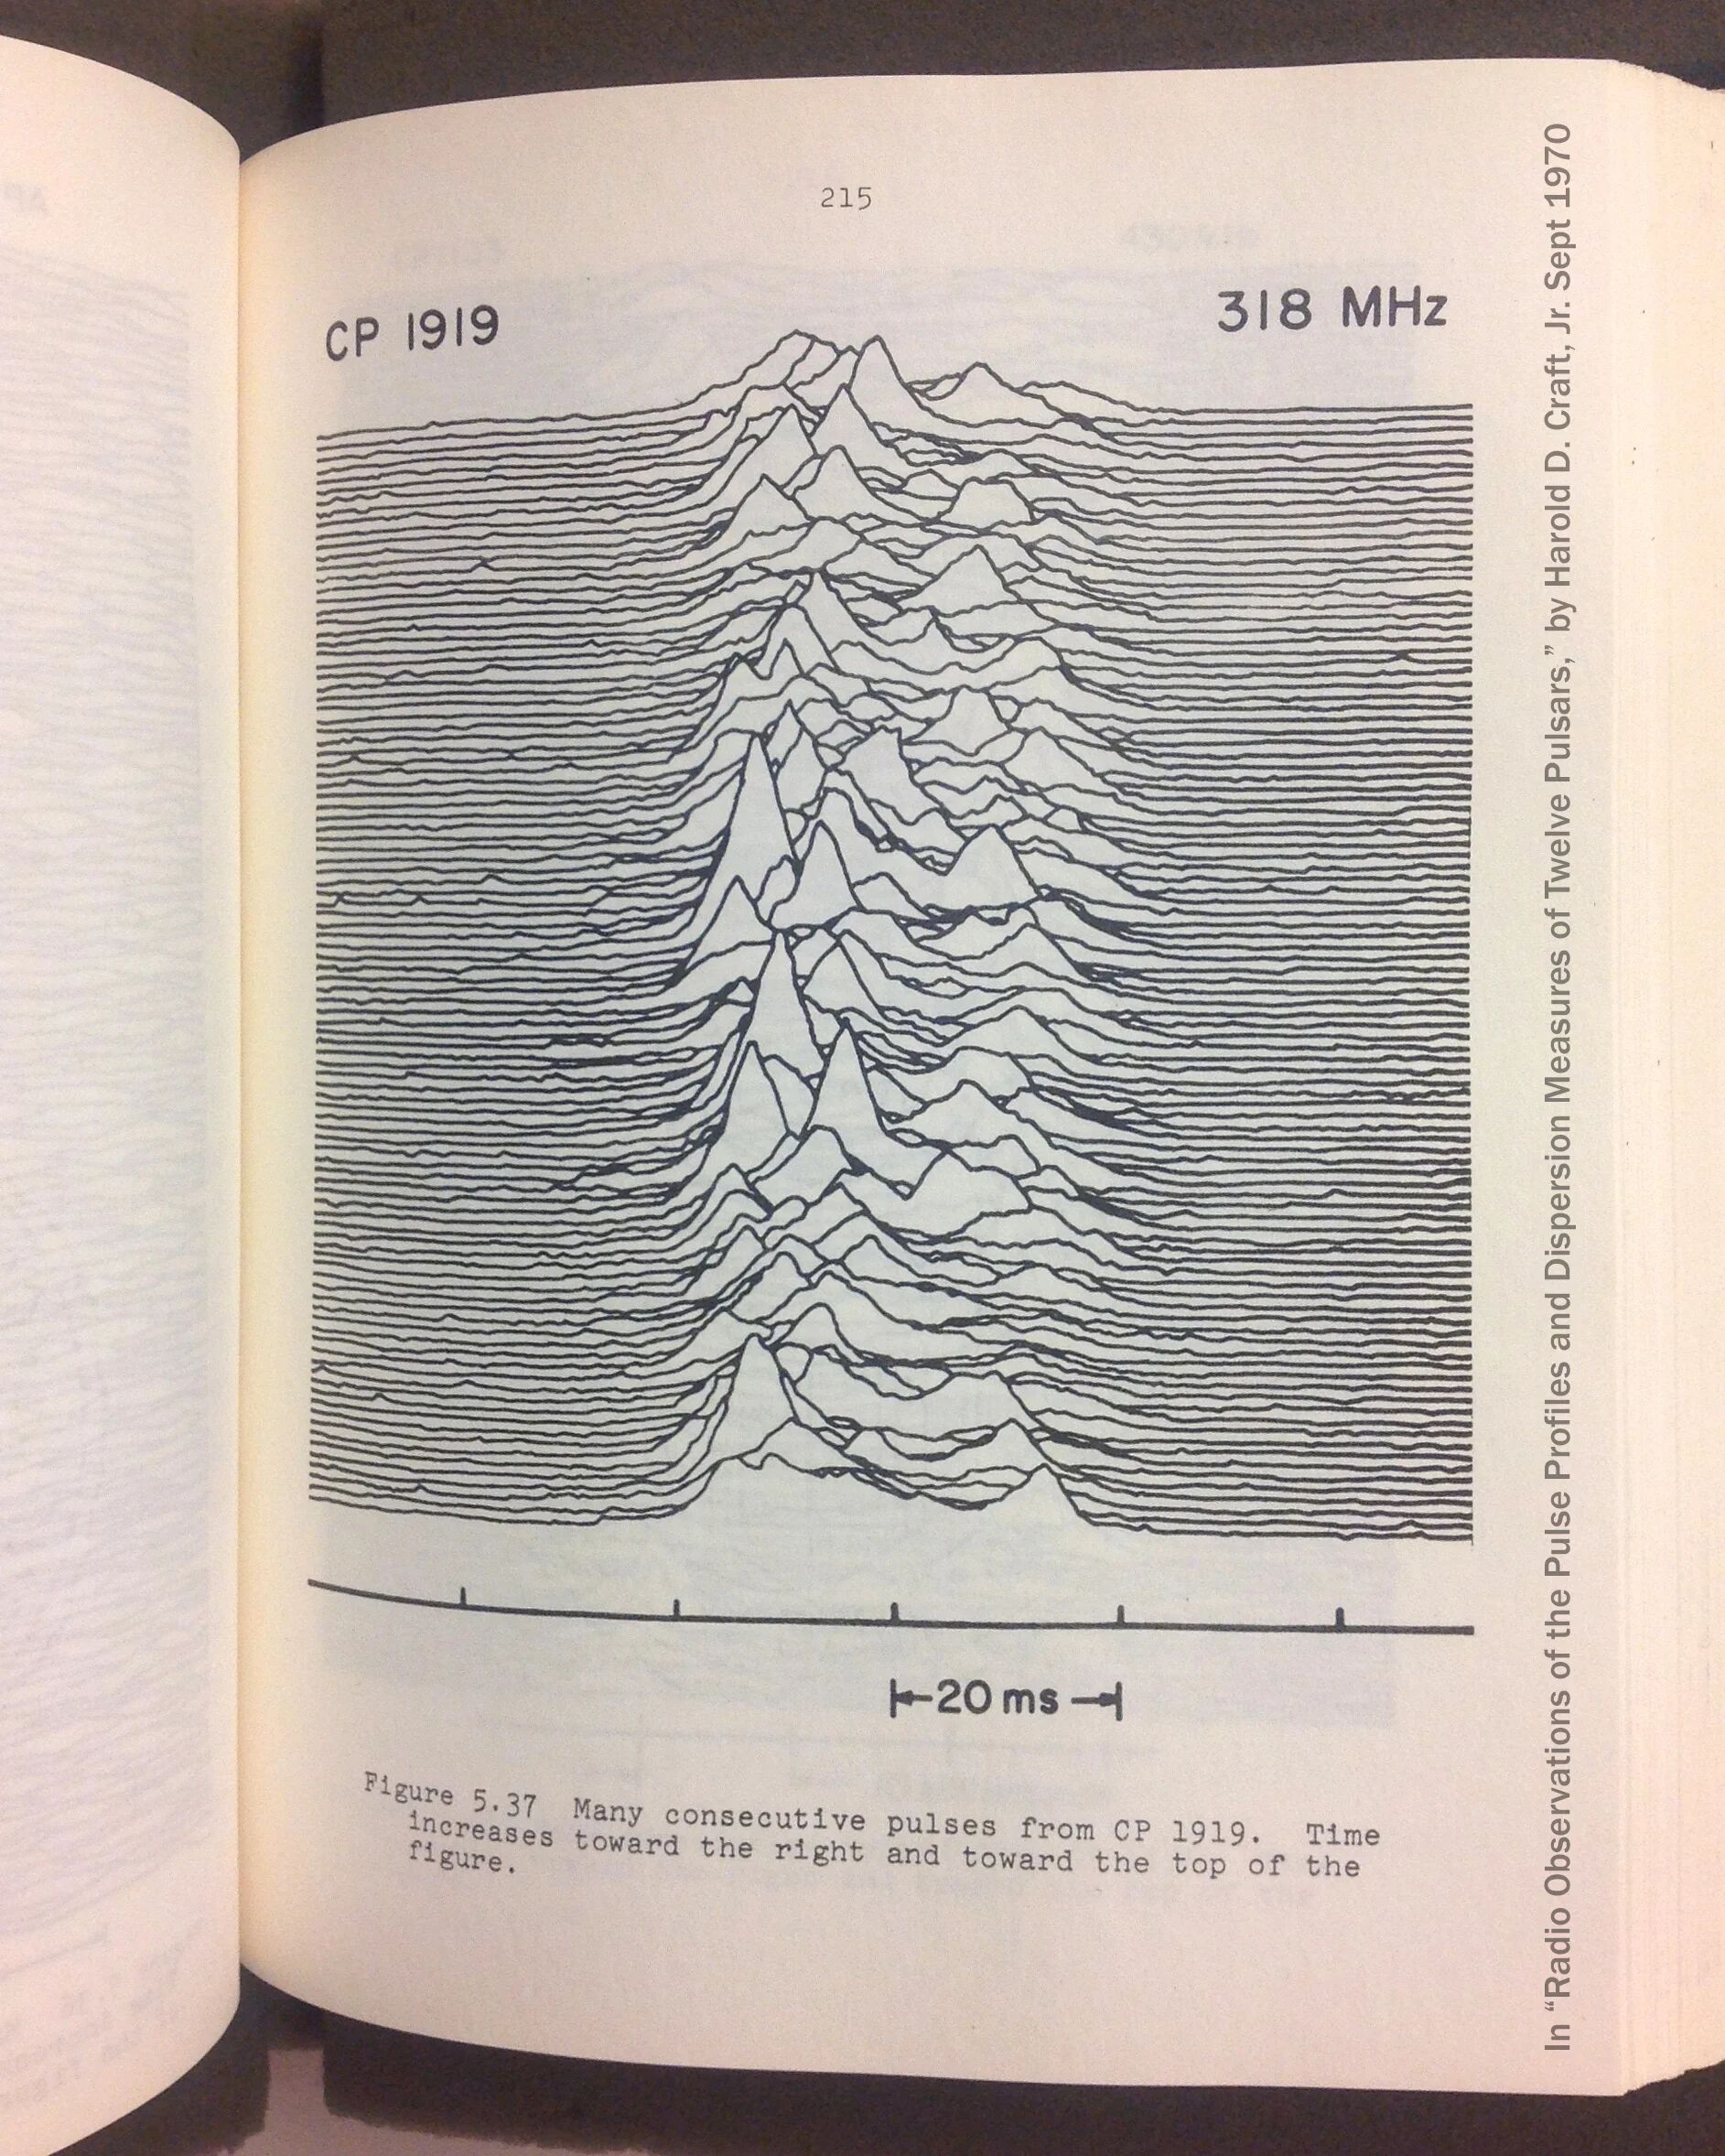
Like the other amigo said, it’s detected emissions from a pulsar. For some more explanation, pulsars spin really fast and emit radio waves, think of it sorta like a lighthouse. So what the image is measuring is the intensity of the radio waves from this pulsar as it spins, with each period stacked in front of the last.
Visual aid from Wikipedia:
As you can see, this one has been simplified to demonstrate the concept, and the actual data is much more varied and interesting to look at; I do not know what causes the peak offsets and would also like an explanation
I didn’t know either so I looked it up, apparently it was the first detected radio pulsar, briefly thought to be an extra terrestrial transmission…and later used on Joy Division album cover: https://en.m.wikipedia.org/wiki/PSR_B1919%2B21


Ok but what is it?
Like the other amigo said, it’s detected emissions from a pulsar. For some more explanation, pulsars spin really fast and emit radio waves, think of it sorta like a lighthouse. So what the image is measuring is the intensity of the radio waves from this pulsar as it spins, with each period stacked in front of the last.
Visual aid from Wikipedia:
As you can see, this one has been simplified to demonstrate the concept, and the actual data is much more varied and interesting to look at; I do not know what causes the peak offsets and would also like an explanation
I didn’t know either so I looked it up, apparently it was the first detected radio pulsar, briefly thought to be an extra terrestrial transmission…and later used on Joy Division album cover: https://en.m.wikipedia.org/wiki/PSR_B1919%2B21